Accelerate workforce transformation
Orgvue has the power to bring people and business data to life through a richer, more visual organizational design and workforce planning experience.
Our customers













Our solutions
For every design and planning challenge, we have a solution. Orgvue puts an organizational structure in place to ensure you have the right people, in the right place, at the right time. Helping you bridge the gap between workforce demand and supply.

Organizational design
Organizational design with Orgvue is an ongoing and cyclical process of continual improvement, with access to best-in-class methodology on a single platform.

Workforce planning
Through a combination of SaaS and advisory services, Orgvue helps you establish the target demand and manage gaps between workforce supply and demand.

Organizational transformation
In a constantly changing world, Orgvue has the design and planning capability to shift your organization structure, size and talent in response to change.

Mergers & acquisitions
Deliver promised value with Orgvue as your workforce planning platform – from post-merger integration and value realization through to workforce optimization.

Agile organizations
Successfully build, run and sustain agile structures for agile organizations with Orgvue.

Workforce transformation
Redefining the work and skills required for your business to thrive. Discover a new way to look at the workforce and learn how Orgvue helps.

What would have taken a couple of days to do in terms of organizational design, people are doing in hours now… it becomes an evolution not a transformation.
Julie Digby, Global Integration
and Transformation Leader, Mars

About our platform
Orgvue is the organizational design and workforce planning platform of choice for businesses that strive to continually evolve.
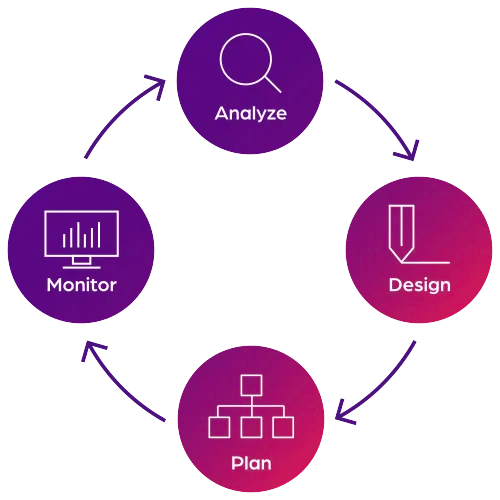
Our platform allows you to analyze, design, plan and monitor your organization. Our insight enables you to spot trends, capitalize on opportunities and plan for what’s next. All this so every foot you put forward is placed with total confidence.
How we help
Accelerate design and planning with features and capabilities aligned to the objectives of your complex organization.
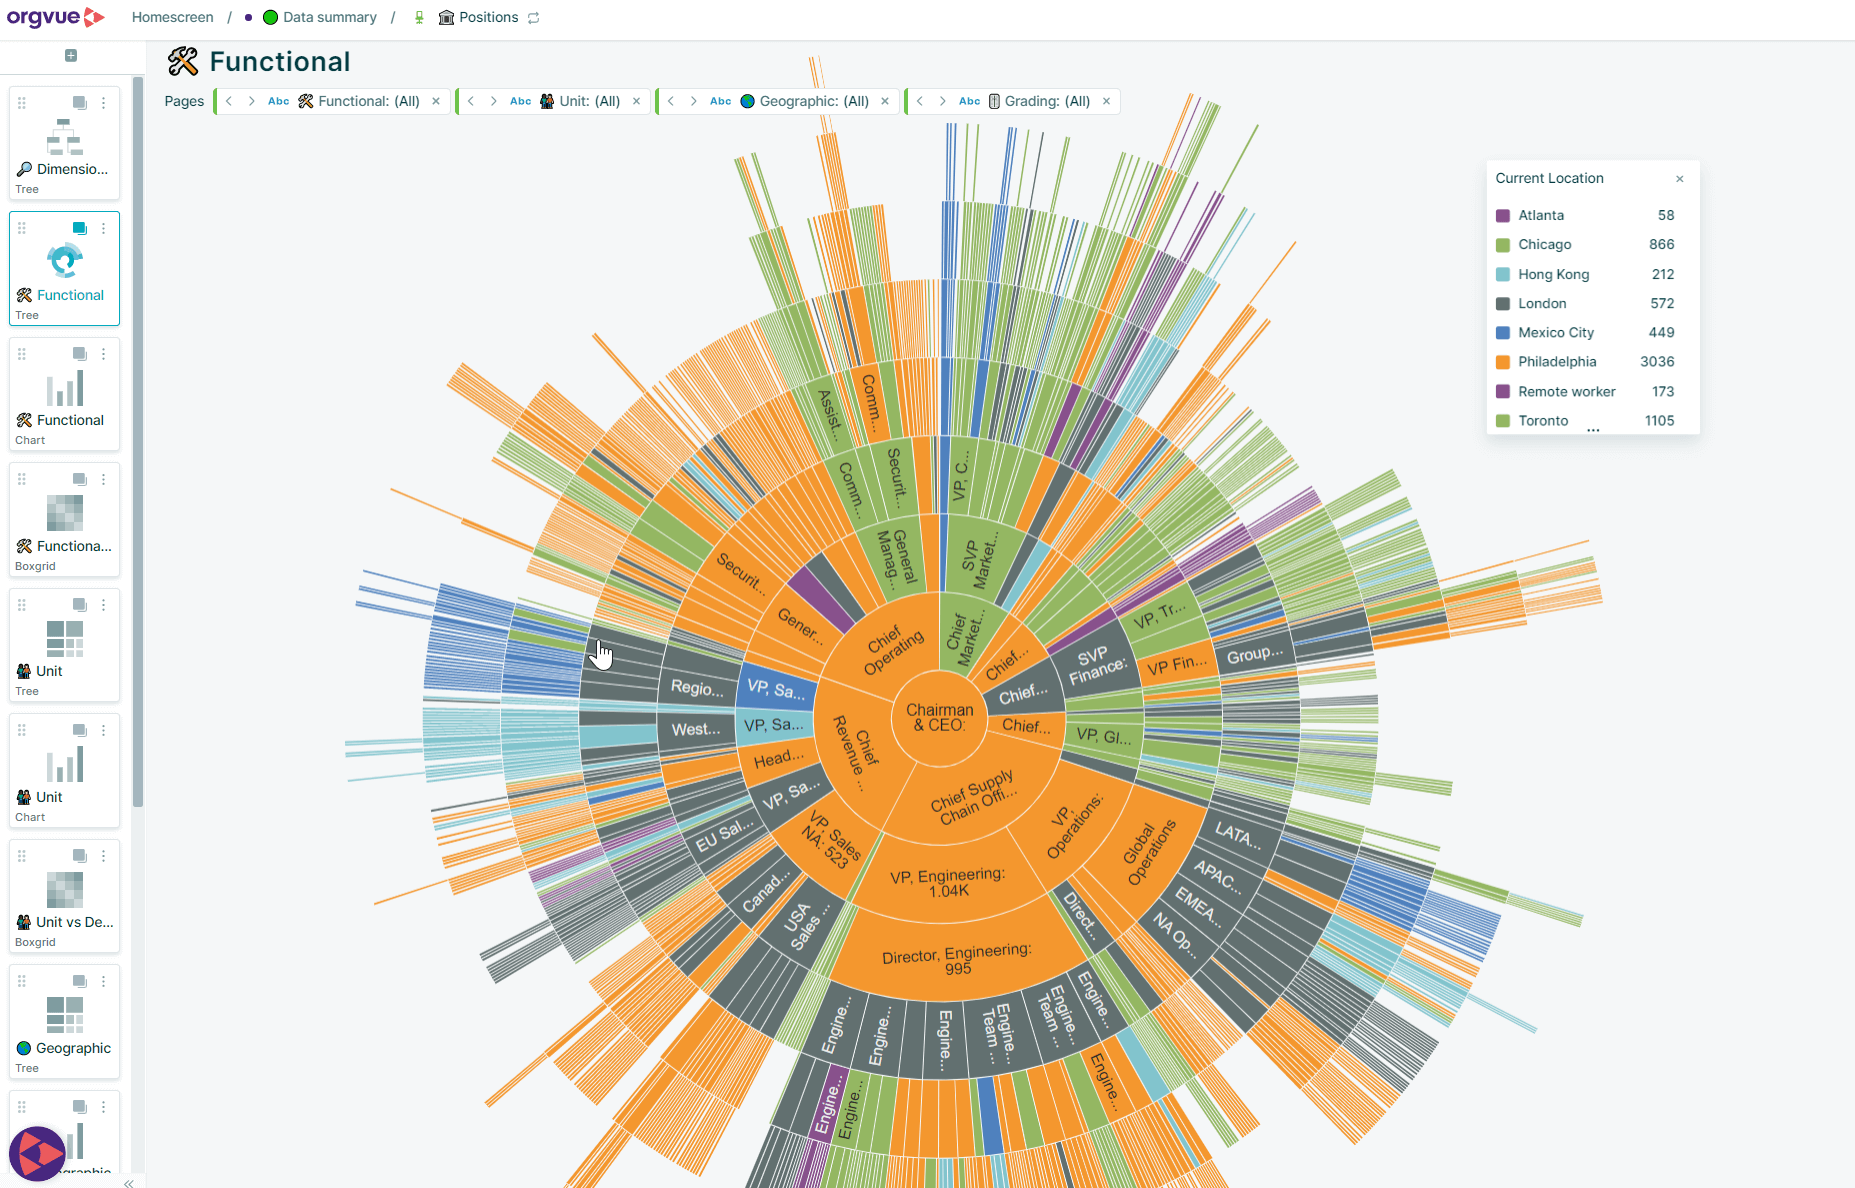
Starting with a clear and in-depth picture of your entire organization, Orgvue gives you the clarity to see, model and reimagine the future. We can help you adapt to change through continuous cycles of workforce planning and organizational design.
The benefits of Orgvue
Transformation
Major global bank
$60m
cost savings
33%
completed project in 1/3 of time
60%
fewer resources needed
Cost reduction
Global chemical business
$300m
fewer resources needed
150
business partners collaborated
2,200
data records in one view
Organizational redesign
Insurance company
23%
saving on labor costs
50%
saving on managerial and overhead costs
30%
reduction in organizational layers

Discovering and utilizing Orgvue has revolutionized my professional endeavors on many fronts, enabling swifter analysis and decision-making through vivid visualization to effectively convey complex narratives.
Jen Solo, Senior Manager, Organizational Strategy & Effectiveness
Webinar
Overcoming data challenges to drive strategic workforce decisions
Explore key challenges and real-world solutions to data challenges with Orgvue experts Amalia Stein and John Lyon.
- Jan 23 | 11AM AEDT | 11AM EST | 11AM GMT

More resources
 Webinar (On-demand)
Winning the Transformation Battle: Experts on How to Overcome the 70% Failure Rate
 Webinar (On-demand)
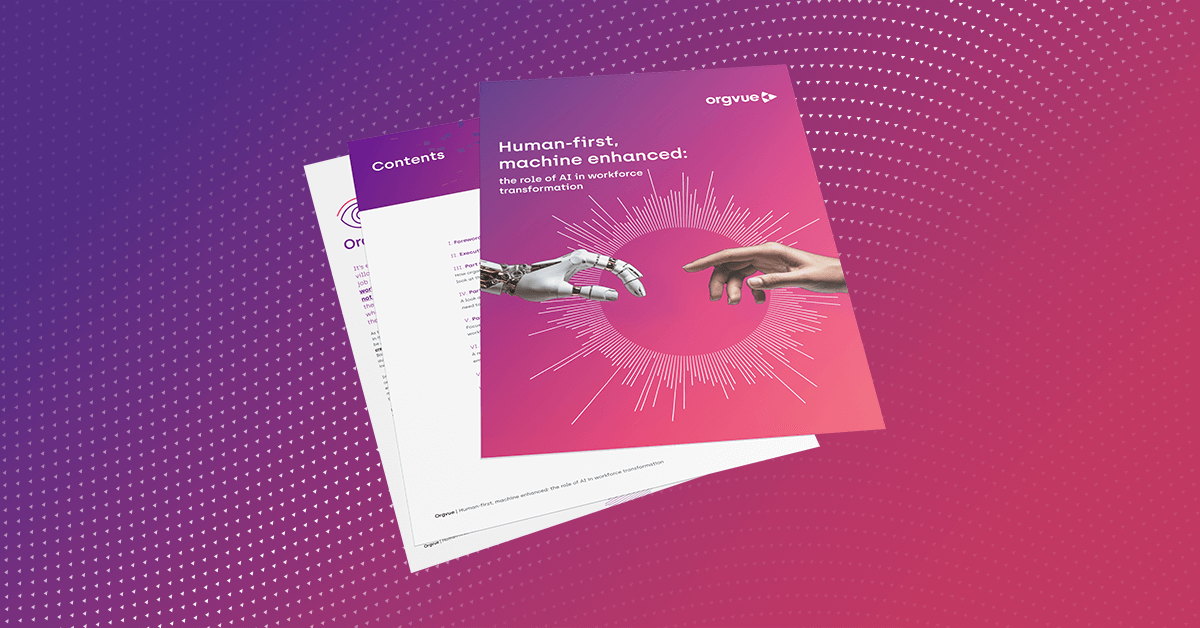
AI in workforce transformation: obstacles, risks and a human first approach